This past November, our teams at HeiGIT and GIScience participated in Topi Tjukanov’s Twitter event #30DayMapChallenge, where mappers display their creativity and ingenuity with a set of 30 daily prompts ranging from colors to specific datasets to geometric limitations in any sort of map one can imagine. The challenge runs for the entire month of November and has been active since 2019.
As we eagerly anticipate the next round of mapping, we’re looking back at our contributions to last year’s challenge. In this series, we’ll speak to some of the mappers to gain insight into the colorful, innovative, and downright stunning submissions from last November. You can read part one, which looked at three versions of Germany produced by HeiGIT researcher Jakob Schnell, here. Part two explored an entire project inspired by Day 22’s NULL prompt centered on deleted OpenStreetMap (OSM) elements, which can be read here. Today, we round up the maps that plot all the reason we love our home in Heidelberg, Germany.
Fittingly, we began last year’s challenge with a video visualization of the expanding OpenStreetMap (OSM) community in Heidelberg starting from 2015. As part of our Geoinformation for Humanitarian Aid team, HeiGIT’s Marcel Reinmuth has published maps on reproductive health and healthcare access, but it was his mapping of street lamps in Heidelberg and the surrounding area that shown a light on the evolution of OSM community mapping for day one’s theme “Points.”
The map displays OSM objects with the tag highway=street_lamps from 04/2015 to 06/2016 and was completed with HeiGIT’s ohsome API. The map was inspired by several online resources including osmstreetlight.bplaced.net and a tutorial by 
Video: Evolution of OpenStreetMap objects with the tag highway=street_lamps from 04/2015 to 06/2016 around Heidelberg, Marcel Reinmuth’s submission for Day 1 (“Points”) of Topi Tjukanov’s Twitter event #30DayMapChallenge. Map derived from OpenStreetMap data.
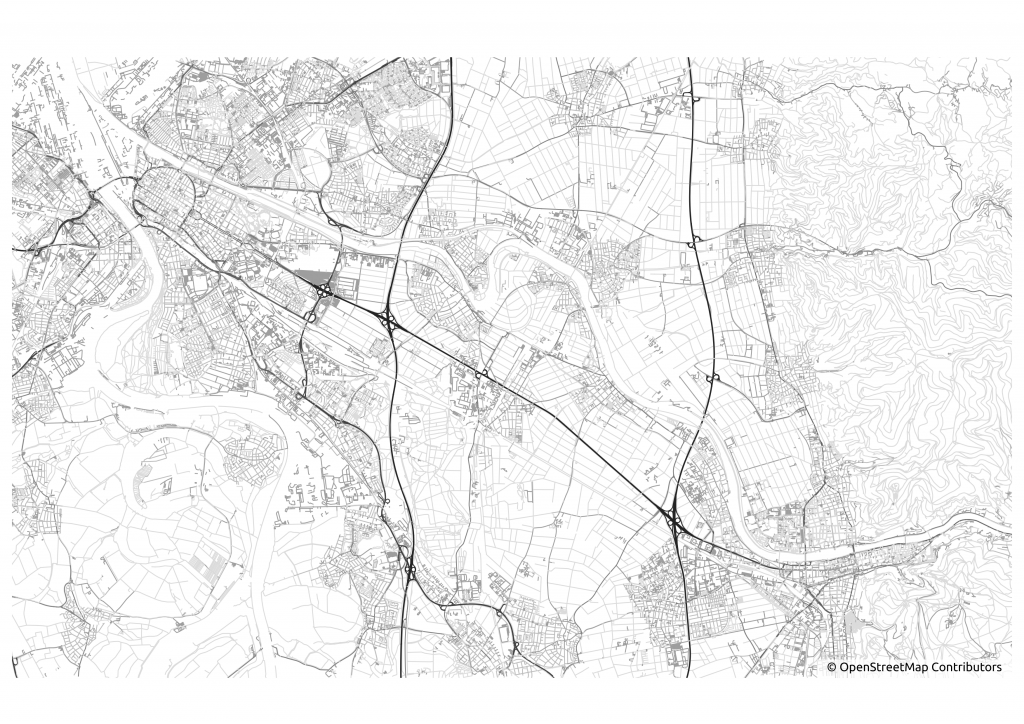
The next day, both Heidelberg and the nearby city of Mannheim were spotlighted for day two with the theme “Lines” by HeiGIT’s Adam Rousell. Adam works as a Research Associate on HeiGIT’s Smart Mobility team. His submission for the challenge brings into focus the extensive road network connecting the area, with clear darker lines for major roadways linking the major cities of the Pfalz region here in Baden-Württemberg in extraordinary monochrome.
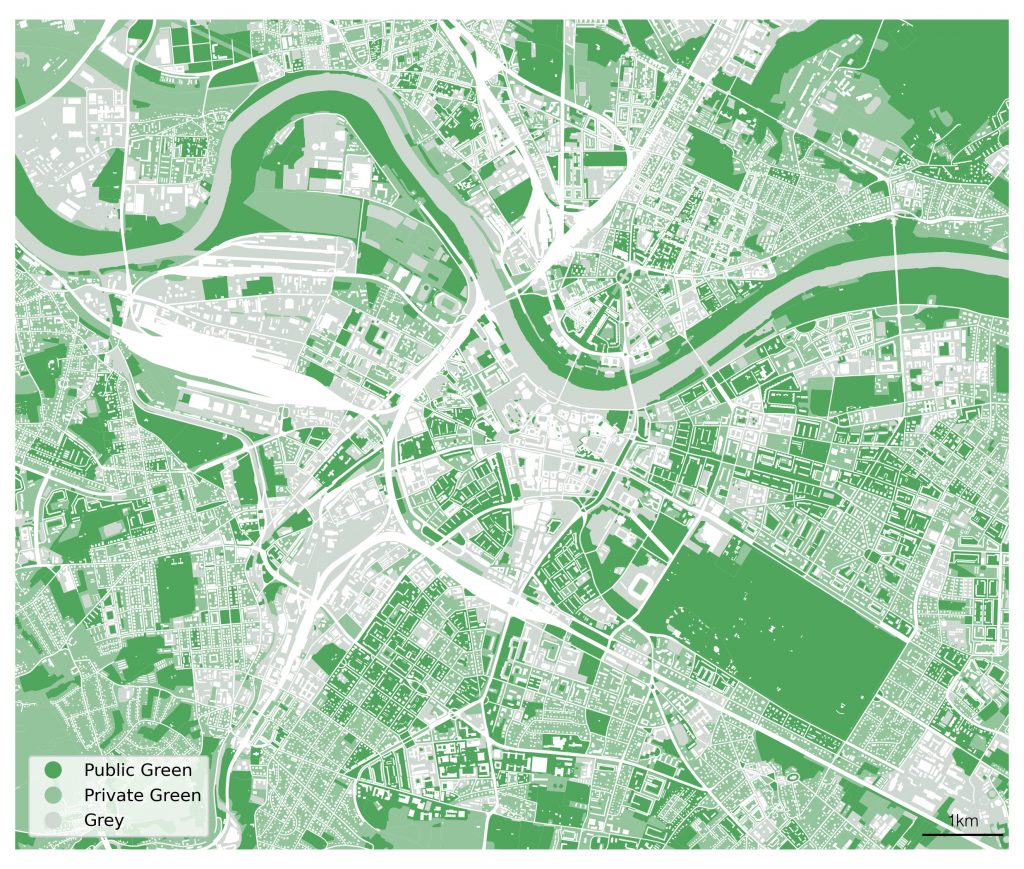
Day four’s theme “Colour Friday” brought a pop of green into our feed, perfect for HeiGIT’s Research Associate and GIScience PhD candidate Christina Ludwig. The theme was ideal for Christina, whose work on the MeinGrün project produces solutions to enable greater access to and incentivize the use of urban green spaces. The topic has become increasingly crucial as climate change warms up Mannheim and nearby cities in the summer, forcing citizens to search for naturally cooler places such as parks and tree-lined embankments for both commute and leisure purposes. The map provides ample room for growth for policymakers and urban planners seeking to make their city greener for environmental or public health reasons.
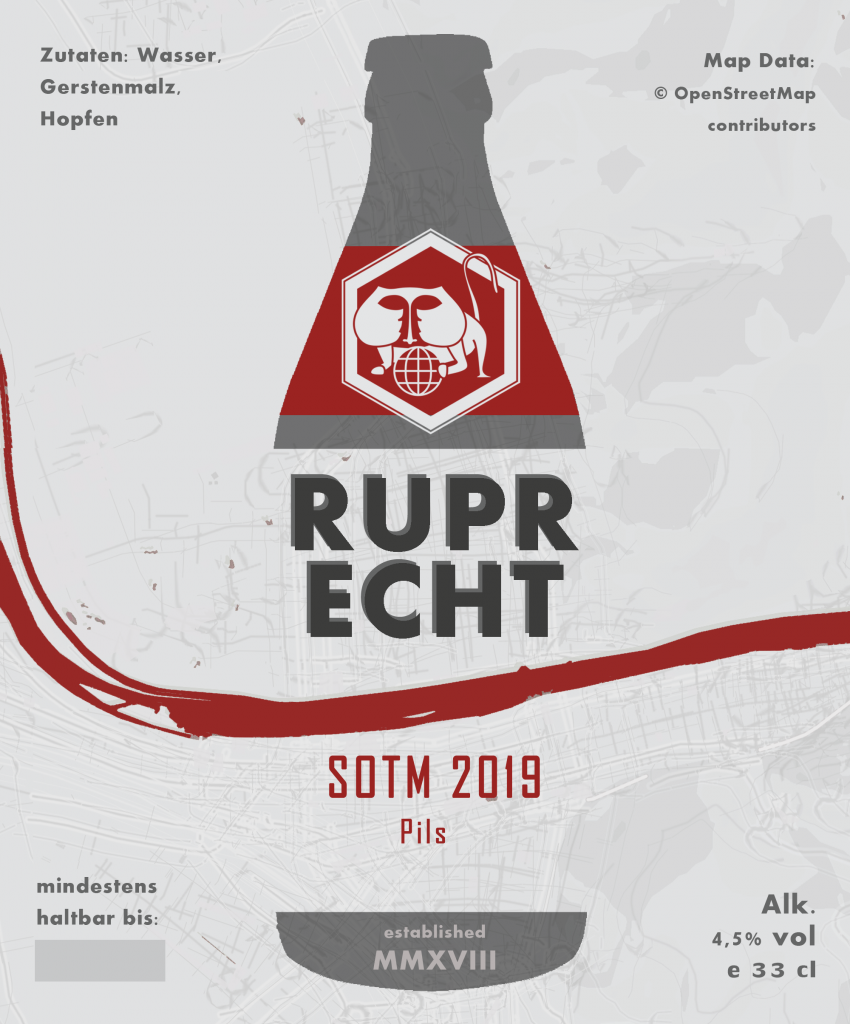
Of course, mapping Germany would be incomplete without a map featuring beer. Heidelberg contains all sorts of locales for the eager hops consumer, from abbeys with centuries-long brewing histories to microbreweries and sunny biergartens. It was only logical, then, to go all out for day 15, with a focus on food and drink and the prompt asking, Where does food come from? Where people consume most coffee? Or maybe you could make a map FROM food?
Benjamin Herfort of HeiGIT’s Big Spatial Data Analytics team produced the following beer map as the perfect answer to such questions, listing only the ingredients (“Zutaten”) permitted by Germany’s 1516 Beer Purity Law (Reinheitsgebot) and drawing a map of Heidelberg using OSM data.
We love maps that explain the culture, infrastructure, and community growth of our hometown of Heidelberg, and these four entries from last year did a fantastic job of that. Simultaneoulsy, HeiGIT and GIScience are a bastion of diversity, with researchers hailing from all parts of the globe. It’s therefore not surprising that many of our entries featured in the final installment of this series laid out worldwide stats on music, values, and buildings from Dar es Salaam to Japan. Check soon for that final update as we conclude our round-up.