With thousands of people mapping in OSM every day, missing building data in urban centers is steadily decreasing. Since OSM is a widely used source for projects researching urban phenomena around the world, a good data quality and an even distribution are important factors. If a spatial bias is present but not accounted for, researchers may draw false conclusions. Determining how OSM data quality varies within and between regions worldwide was a key goal of the research of Benjamin Herfort in 2022-2023. The main method for determining OSM data quality was to build a model using random forest regression that estimates building area using various predictors such as visual night light and the subnational human development index. You can read out more about previous research on the topic here. This research has now been repeated with more recent data and more urban centers.
Findings of the first research
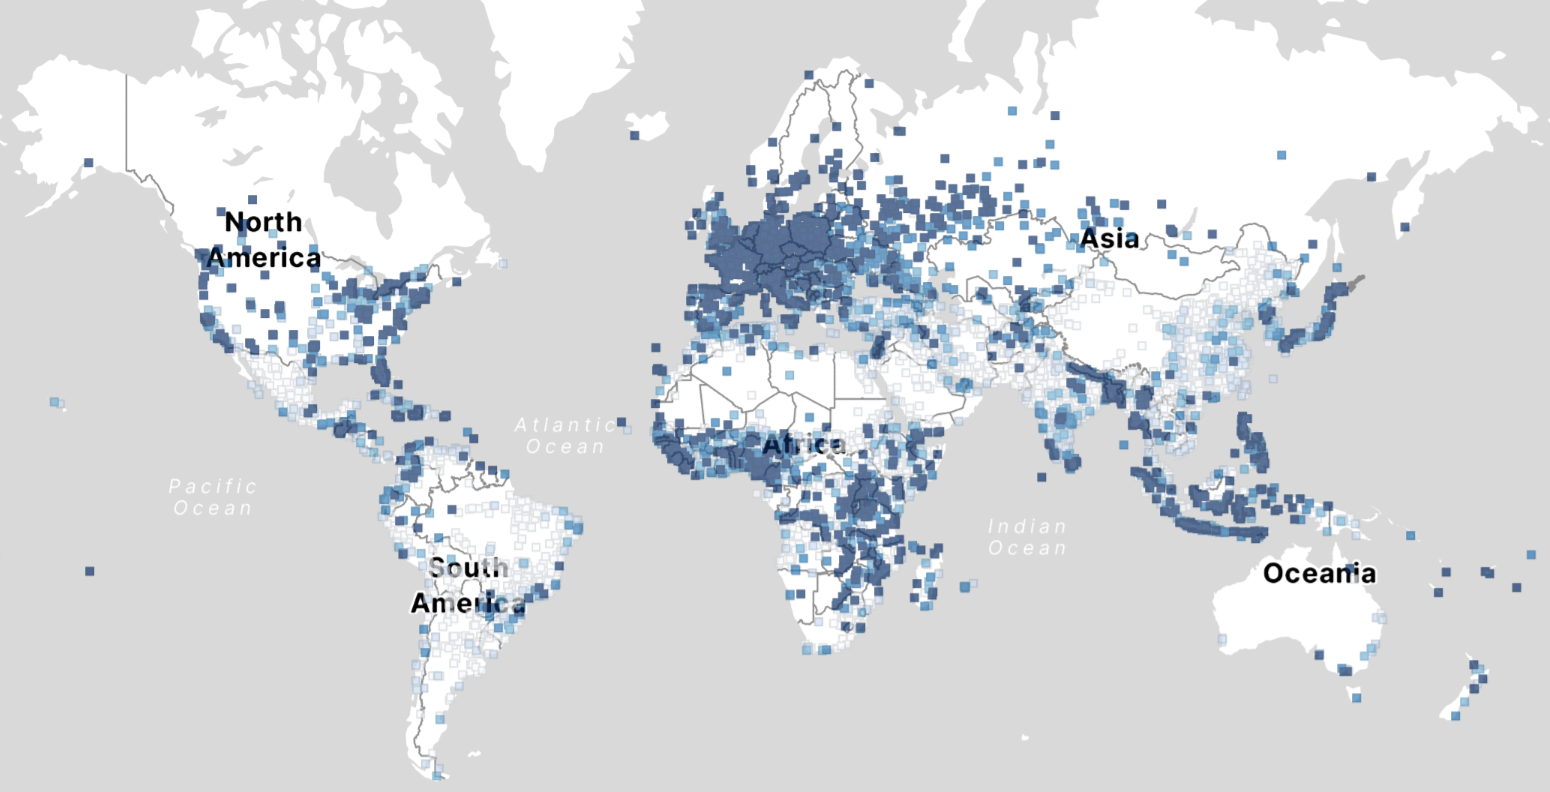
The research of Benjamin Herfort found the worldwide building completeness to be 21% per urban center. This means that only 21% of buildings are mapped on average per city. Europe, Central Asia and North America all had relatively high completeness, with values above 50% per urban center. The regions Latin America, Caribbean, East Asia, South Asia, Pacific, Middle East and North Africa all had significantly lower completeness rates, all being between 7 and 17%. Interestingly, Sub-Saharan Africa showed much more mapping activity than North Africa.
Urban centers with a very high SHDI (Sub-national Human Development Index) expectedly had comparatively high completeness rates. But, those with a low SHDI had high completeness rates as well (higher than urban centers with a medium/high SHDI)- a phenomenon likely caused by humanitarian mapping activities. Also, larger urban centers correlated with higher completeness rates.
Between 2008 and 2014, mapping efforts mostly focused on cities near already well-mapped cities, creating a sort of clustering effect of mapped regions. However, since then, clustering was found to have significantly decreased, although it is still present.
What has changed?
We still rely on the same methodological approach and the JRC’s urban centers database. To these geometries we added the same indicators as in the first analysis on a grid cell level, but this time the latest available or updated versions : Population distribution, SHDI, nighttime lights, tree cover, built up area, vegetation and the urban road network. The only thing we improved about these indicators was involving Microsoft road length data as well and not only OSM data as a reference for the cases where OSM data is missing.
Furthermore, to get the OSM references for building area and road length we queried the ohsome API and included more recent timestamps: January 2024 and May 2024.
But did the model improve? On a grid level yes, the completeness prediction was more accurate, but on the urban center level it was a little less precise. Still, these differences are not severe and both models come to the same general results. You can read about the details on GitHub.
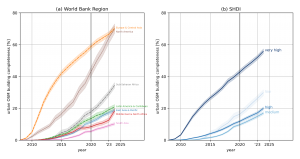
Completeness wise between 2023 and 2024 you could see the trend of completeness rates rising slowly or stagnating in most parts of the world but slower than in previous years. Especially in the areas with high completeness you could compare it to the end of an exponential curve when it was mapped continually. Low SHDI cities, that were probably mapped in humanitarian mapping efforts have more constant completeness values, indicating single mapping event efforts. From January 2023 to May 2024, average completeness per urban center has increased by 2.8%. The highest increase by region is in North America, Middle East & North Africa and Sub-Saharan Africa, having an increase between 5% and 6.1% (Fig. 1 a). Regions with a low or very high shdi have increased their completeness by 3.5% and 3.7% in this timespan while regions with a medium or high SHDI have increased their completeness by 2.0% and 2.9% respectively (Fig. 1 b).
On the level of individual cities, Lagos, Nigeria has the highest increase in completeness of all urban centers with an area over 150km2. Nigeria stands out in general as well, as 5 out of the top 20 cities over 150km2 with the highest completeness increase are Nigerian cities. 13 of these top 20 cities are from the regions Middle East & North Africa or Sub-Saharan Africa. With an increase of 37.9%, Montreal, Canada is one of the few cities with a very high SHDI and an area of over 1000km2 to have a substantial increase in completeness. Other large Canadian cities like Toronto, Québec and Ottawa either already had a completeness of over 90% before or have not changed, remaining at a completeness of around 50%.
Work with the data
If you would like to use the data from this project for your own research, you can find the geopackage with all the data used for this research here. The updated data was also uploaded on a grid dimension in ohsomeHeX. In this application you can zoom into any urban grid and see the building completeness as well as how it evolved since January 2008. In the video below you have a few possibilities visualized.
To keep up with future developments and releases related to this project as well as other efforts to advance geospatial technology in the mobility, humanitarian aid, and data analytics space, follow our social media channels and stay up to date on our blog.