Campus reporter Nils Birschmann spoke with Prof. Alexander Zipf about our Disaster Portal. The interview was broadcast on Radio Regenbogen. You can listen to the full length of the article here (please note: the interview is only available in … Read More
Blog
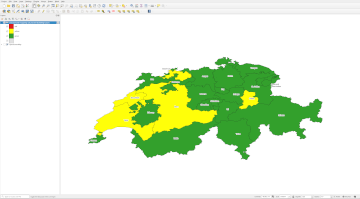
Visualizing OQT API Results in QGIS
Using the ohsome dashboard, it is possible to explore quality estimation for OpenStreetMap (OSM) data from the ohsome quality analyst (OQT) for arbitrary regions. Also, OQT does provide an API to programmatically fetch quality estimation for a lot of different … Read More
Bachelor’s thesis: Using OSM for location analyses of residential real estate projects – an extrinsic analysis of data quality
In his bachelor’s thesis, supervised by HeiGIT’s apl. Prof. Dr. Sven Lautenbach, Lars Reckhaus examined the suitability of OpenStreetMap (OSM) for location analyses in the context of residential real estate projects. Typically, such analyses require the use of a variety … Read More
Introducing ohsomeNow stats: Real-Time Monitoring for OpenStreetMap Contributions
You can now monitor contributions to OpenStreetMap (OSM) in real time with ohsomeNow stats! We developed this new dashboard as part of our long-term cooperation with the Humanitarian OpenStreetMap Team (HOT), an international organization dedicated to humanitarian action and community … Read More
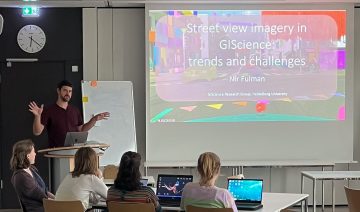
Recap Road Quality Mapathon
Last Monday, on July 31st, we hosted a road quality mapathon, which saw the participation of students and researchers alike. Their collective efforts led to the classification of nearly 50% of all the pre-selected road pictures in 34 African countries. … Read More
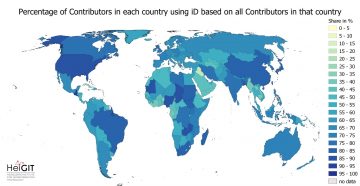
Exploring OSM editor statistics by combining data from OSHDB and changeset DB
Exploring OSM editor statistics by combining data from OSHDB and changeset DB OpenStreetMap (OSM) marks one of the most successful and powerful open source, crowdsourced geomaps, with over 10 million registered users by 2023. Since 2008 this number has increased … Read More
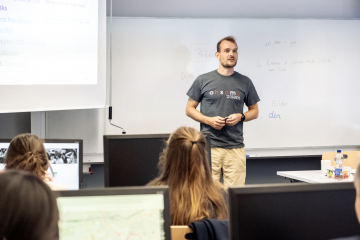
HeiGIT at Summer School Disaster Risk Reduction 2023
Today we’d like to tell you about the Summer School Disaster Risk Reduction 2023 event hosted by the Environmental Campus of UAS Trier in Germany and organized by the German Committee for Disaster Reduction (DKKV). During this one-week course that … Read More
Safely through the heat with HEAL: Transdisciplinary project helps at-risk groups in everyday life
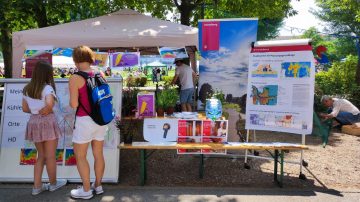
The transdisciplinary project HEAL involves citizens in the research process on heat stress in the city: The aim is to make everyday life easier for at-risk groups during heat waves. The Heidelberg Institute for Geoinformation Technology (HeiGIT), supported by the … Read More
Research Visit at Universidade Federal Fluminese (UFF) in Rio de Janeiro
In context of his research on mosquito monitoring and inner-urban dengue occurence, PhD student and GIScience team member Steffen Knoblauch visited the “Universidade Federal Fluminese” (UFF) in Niterói, State of Rio de Janeiro, Brazil. He was invited to meet collaborators and … Read More
End of Semester Mapathon
At the end of the semester will be another Mapathon! When: Monday, 31.07.2023, at 6 p.m. Where: Mathematikon, INF 205, 5th floor, conference room After a short introduction by Dr. Nil Fulman on “Street view imagery in GIScience: trends and … Read More

Advancing Geospatial Techniques for Vector-Borne Disease Research: Insights from GIScience-CSIAD Collaboration – a conference recap
Recently, Hanse-Wirtschaftskolleg hosted its meeting which brought together experts from GIScience and CSIAD lab, along with renowned researchers from universities in Germany, Thailand, and Ghana, serving as a platform for interdisciplinary collaboration on vector-borne diseases. This event brought together esteemed … Read More
New paper “Urban Heat Island Intensity Prediction in the Context of Heat Waves: An Evaluation of Model Performance”
Aner Martinez-Soto, Johannes Fürle and Alexander Zipf published the paper “Urban Heat Island Intensity Prediction in the Context of Heat Waves: An Evaluation of Model Performance”. It was presented at the 9th International Conference on Time Series and Forecasting in … Read More
13th International Symposium on Digital Earth
From 11th until 14th July 2023 the 13th International Symposium on Digital Earth took place at Athens Greece Harokopio University. As a member of the International Symposium on Digital Earth (ISDE) Prof. Dr. Alexander Zipf was invited to deliver a … Read More
New Publication in “Nature Communications” on the Unequal Distribution of Building Data in OSM
Benjamin Herfort and his colleagues Sven Lautenbach, João Porto de Albuquerque, Jennings Anderson and Alexander Zipf published an article in the renowned journal Nature Communications (Impact Factor 2023: 17.7). In their article, they address the uneven distribution of OpenStreetMap data … Read More

Integration of OQT into the ohsome dashboard: Computing data quality metrics for OpenStreetMap
The ohsome dashboard has been and continues to be an easy access point to generate accurate statistics about the historical development of OpenStreetMap data for arbitrary regions. Now, the ohsome dashboard got extended to be able to compute data quality … Read More
Unleashing the Power of AI-Assisted Mapping in OpenStreetMap? – a webinar with HOT and Masaryk University
The ever-increasing volume and speed of corporate or machine learning-assisted mapping present unique challenges for individual volunteer mappers, particularly in terms of monitoring and validation. While the global impact and evolution of AI-assisted mapping in OpenStreetMap (OSM) remain largely unknown, … Read More
HeiGIT in Berlin with BMBF and AWI on the publication of the Participatory Research Strategy
On 27th June 2023, Oliver Fritz and Sabrina Marx from HeiGIT’s Geoinformation for Humanitarian Aid team joined their colleagues of the Alfred Wegener Institute (AWI) in Potsdam for a workshop with students of the Dathe Gymnasium in Berlin, a partner … Read More
Looking back at FOSS4G Conference 2023
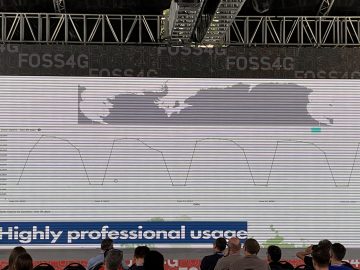
Figure 1: FOSS4G 2023, QGIS daily openings This years FOSS4G conference took place from 26 June – 2 July 2023 in beautiful Prizren, Kosovo. Since 2006 FOSS4G, the largest global gathering for geospatial software, is organized by the Open … Read More
Workshop on Intelligent Systems for Vector-Borne Disease at HWK
Heidelberg as a GeoHealth Hub: GIScience team member Steffen Knoblauch was invited by the Hanse-Wirtschaftskolleg to an event of the working group for Intelligent Systems for Vector-Borne Disease. Various sessions will be held, amongst others the session about Mosquito Monitoring … Read More
HeiGIT at the US State of the Map Conference (June 2023)
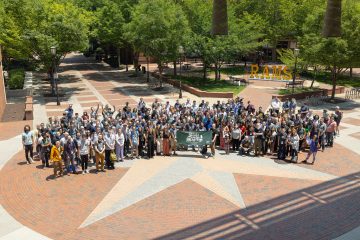
State of the Map US 2023, a conference all about OSM where mappers, businesses, government agencies, and non profits come together to exchange ideas, learn, and work together on OSM related topics, took place from June 8th to June 12th … Read More
