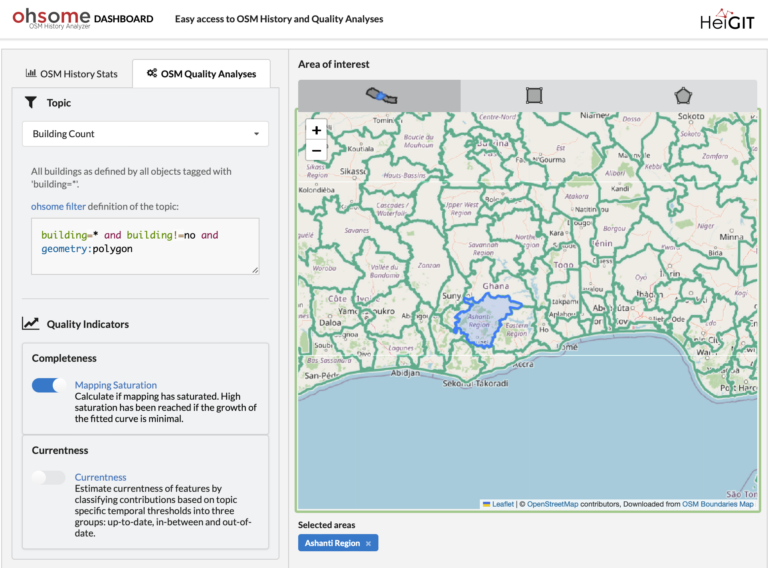
Are you ready to take your OpenStreetMap (OSM) data analysis to the next level? We’re excited to showcase the latest features of our ohsome Dashboard, designed to provide you with…
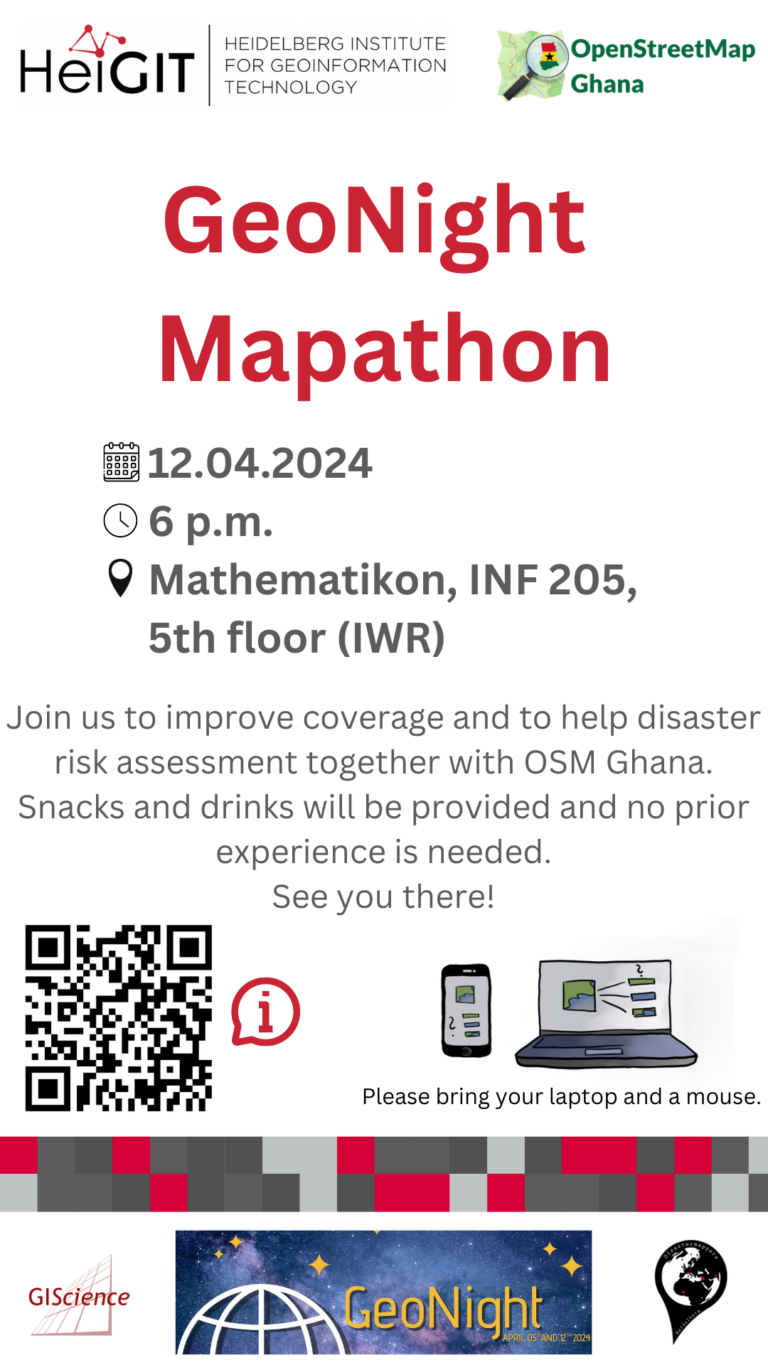
Our next Mapathon is just around the corner, and this time, we’re joining forces with OpenStreetMap Ghana to improve coverage and to help disaster risk assessment. Join us and be…
The use of open-source geospatial data, exemplified by services like openrouteservice (ORS), proves to be beneficial for both academic research and use case studies. Witnessing our technologies applied in unanticipated…
We are happy to announce that the IDEAL-VGI project by GIScience has been successfully completed. IDEAL-VGI was a tandem project in cooperation with Begüm Demir from the TU Berlin and…
A new rate limit is introduced The OpenStreetMap (OSM) API recently introduced a rate limit, which is designed to limit the impact of a particular kind of map vandalism: new…
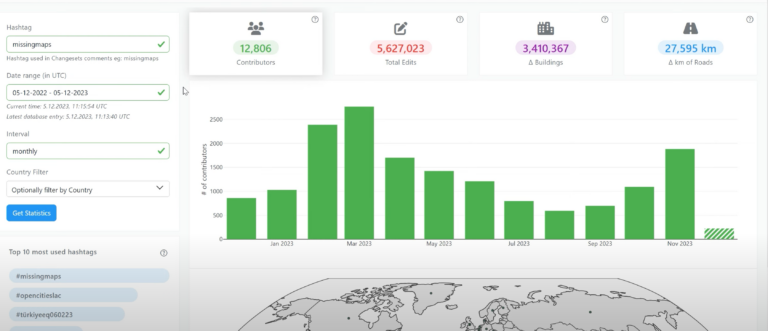
Today, we’d like to shine a light on the online tool OhsomeNowStats. OhsomeNowStats allows users to take a look at the mapping activity in OpenStreetMap. This is especially useful for…
As 2023 is coming to an end, we would like to take the opportunity to look back at this eventful year and appreciate the advance that HeiGIT has made towards…
The HeiGIT team recently secured the top position in the third edition of the Open Source Software for Sustainable Development Goals (OSS4SDG) hackathon. These hackathons are based on the 17…
Introduction In this blogpost we are taking a look at humanitarian mapping through the Tasking Manager (HOT-TM) that is operated by the Humanitarian OpenStreetMap Team (HOT). At HeiGIT we work…
We would like to congratulate Dr. Christina Ludwig on successfully defending her PhD on how to map urban green spaces using OpenStreetMap (OSM) data last month. In her thesis Christina…
The completeness of the OpenStreetMap (OSM) road network has been an ongoing focus for researchers for more than 15 years. For instance, Neis et al. (2011) investigated the OSM street…
The Sketch Map Tool (SMT) is entering its next project phase thanks to support from the German Red Cross (GRC) and the German Federal Foreign Office. In this phase, our…
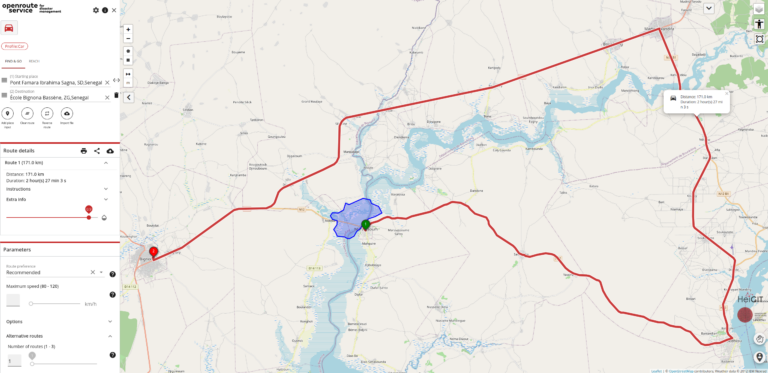
In the context of disaster management, time is of the essence. Quick and accurate response can make all the difference in saving lives and mitigating damage. That’s why the openrouteservice…
Campus reporter Nils Birschmann spoke with Prof. Alexander Zipf about our Disaster Portal. The interview was broadcast on Radio Regenbogen. You can listen to the full length of the…
In his bachelor’s thesis, supervised by HeiGIT’s apl. Prof. Dr. Sven Lautenbach, Lars Reckhaus examined the suitability of OpenStreetMap (OSM) for location analyses in the context of residential real estate…
You can now monitor contributions to OpenStreetMap (OSM) in real time with ohsomeNow stats! We developed this new dashboard as part of our long-term cooperation with the Humanitarian OpenStreetMap Team…
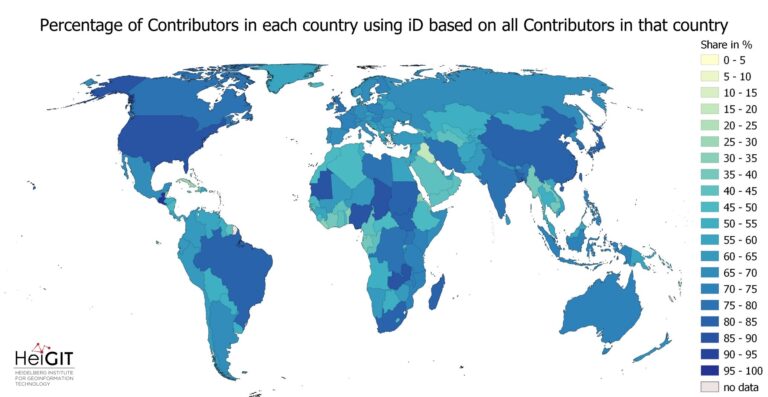
Exploring OSM editor statistics by combining data from OSHDB and changeset DB OpenStreetMap (OSM) marks one of the most successful and powerful open source, crowdsourced geomaps, with over 10 million…
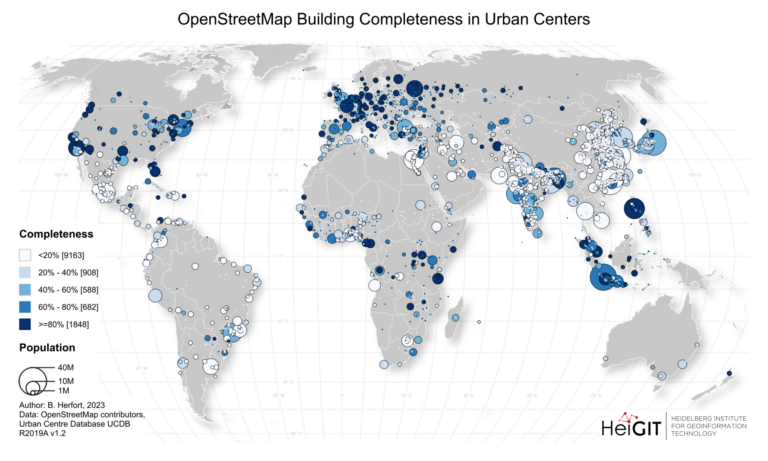
Benjamin Herfort and his colleagues Sven Lautenbach, João Porto de Albuquerque, Jennings Anderson and Alexander Zipf published an article in the renowned journal Nature Communications (Impact Factor 2023: 17.7). In…
The ohsome dashboard has been and continues to be an easy access point to generate accurate statistics about the historical development of OpenStreetMap data for arbitrary regions. Now, the ohsome…
After introducing the OSM Element Vectorisation Tool last week, we now want to show possible use cases and specific examples of what the tool can do. This third and last…